> ## Documentation Index
> Fetch the complete documentation index at: https://docs.chartdb.io/llms.txt
> Use this file to discover all available pages before exploring further.
# Adding Tables and Fields
> Learn how to add and manage tables and fields in ChartDB to visualize your database schema effectively.
 ChartDB provides a visual and intuitive way to add tables and fields to your database diagram.
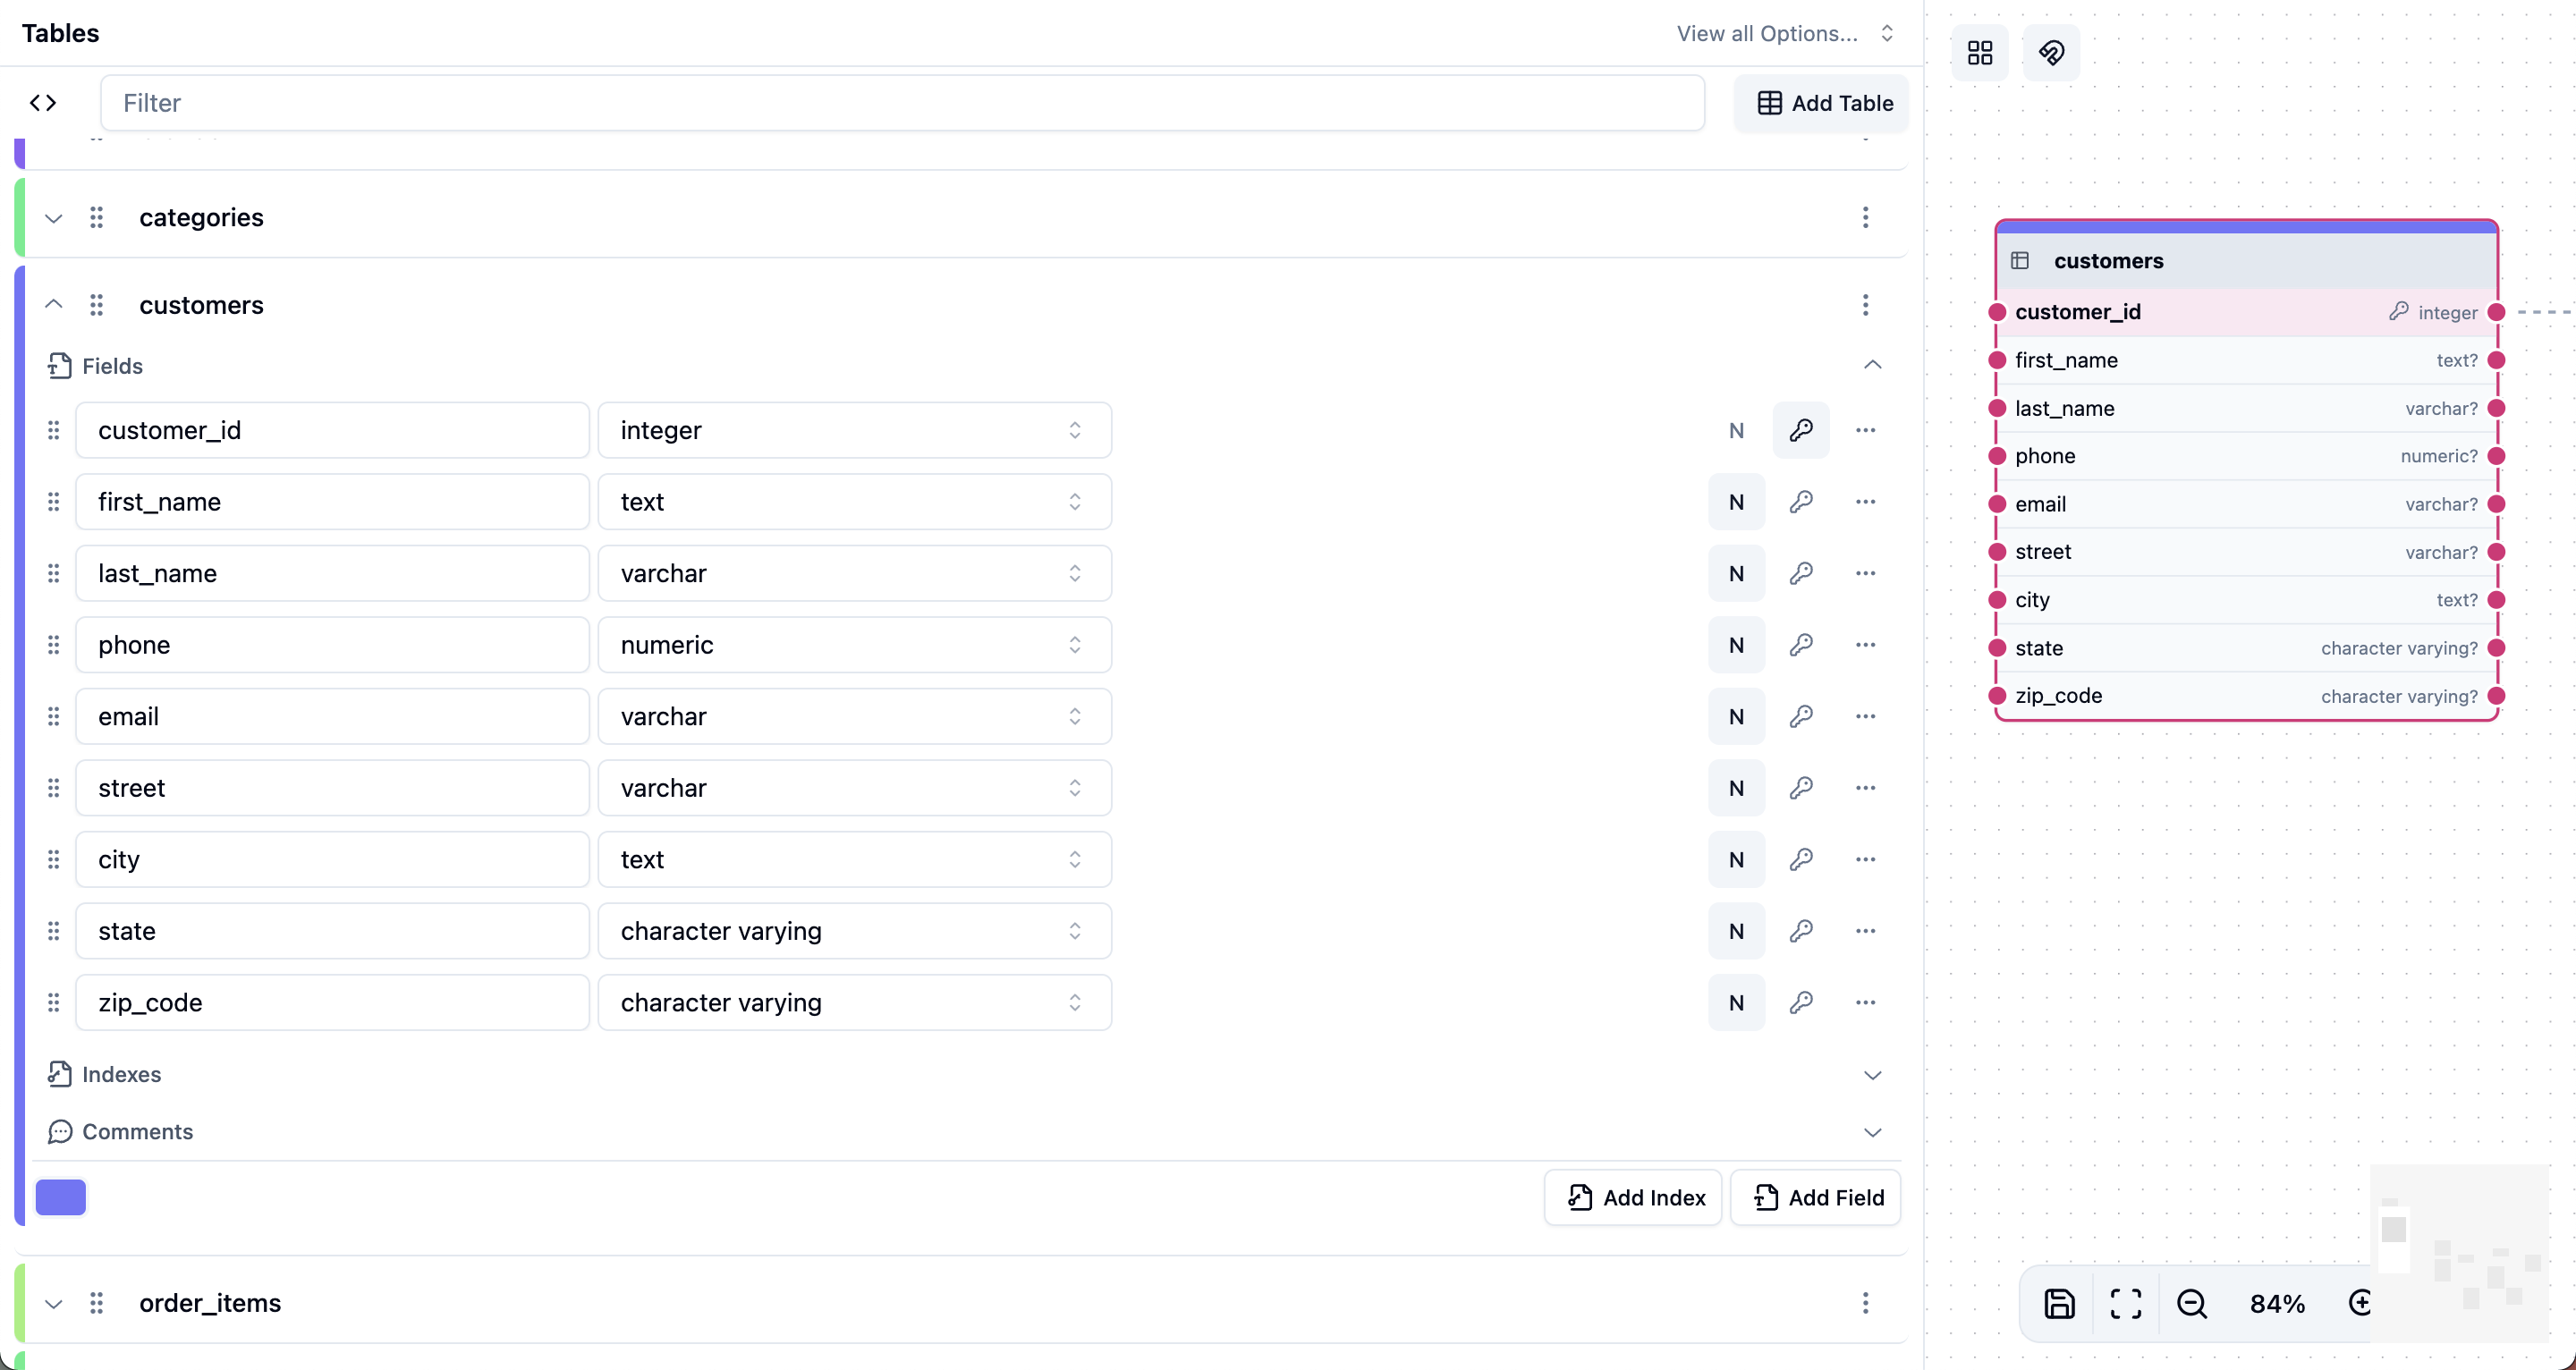
## Add New Tables
To add new tables, you can use the sidebar or interact directly with the canvas.
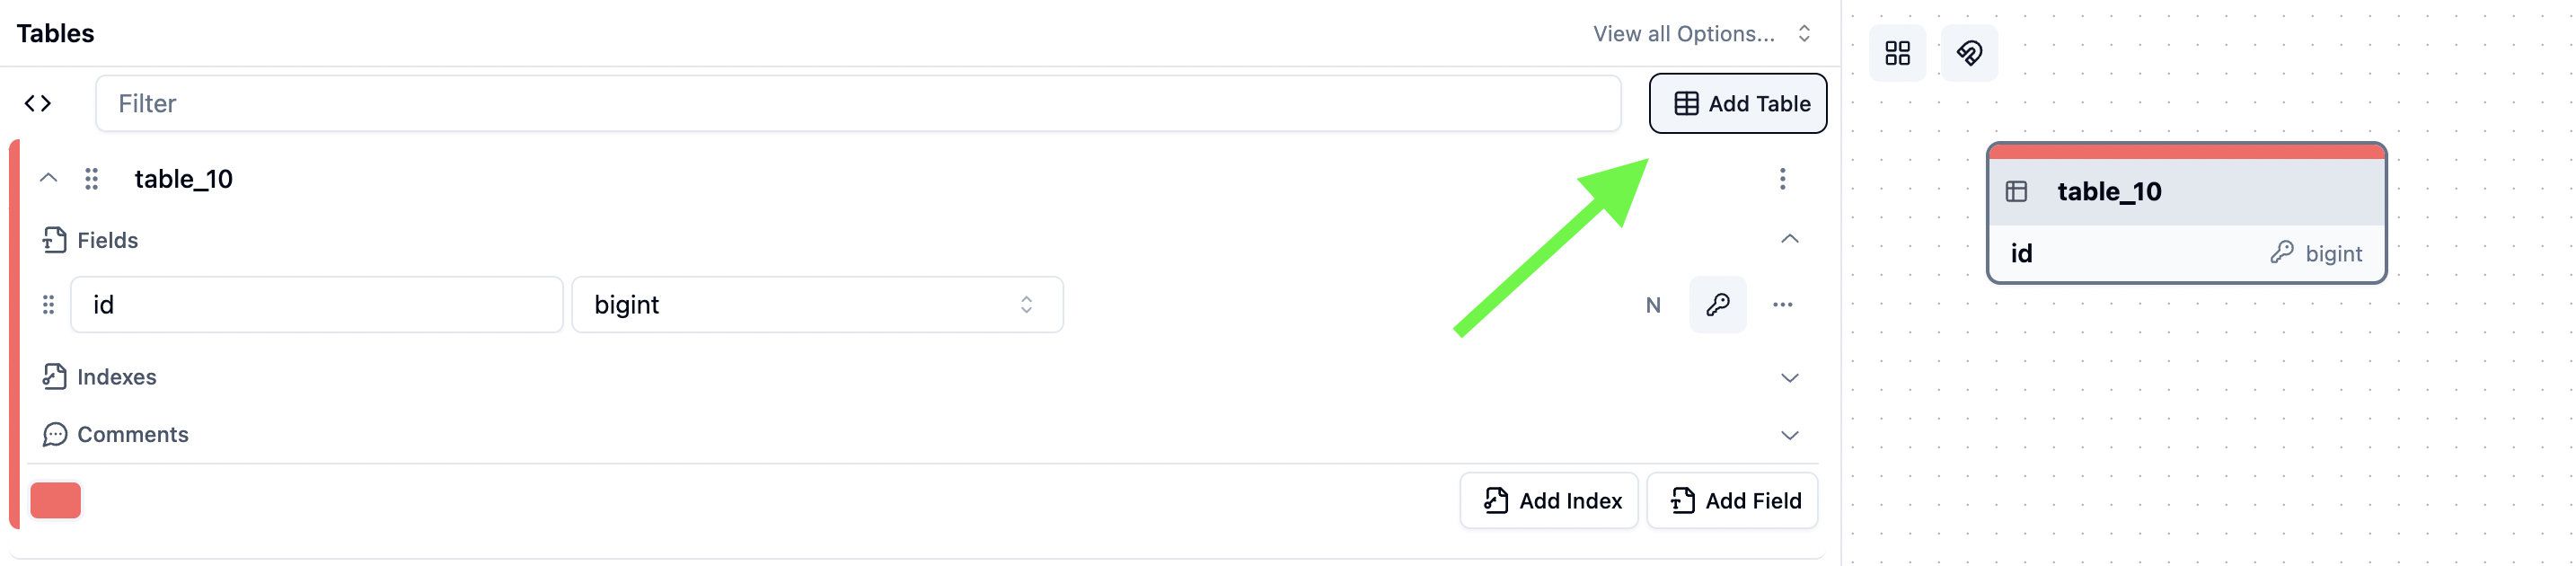
First, **navigate to the *Tables* section** in the ChartDB sidebar and click the 'Add Table' icon.
This instantly creates a new table in your diagram with a randomly generated name and a single default field.
ChartDB provides a visual and intuitive way to add tables and fields to your database diagram.
## Add New Tables
To add new tables, you can use the sidebar or interact directly with the canvas.
First, **navigate to the *Tables* section** in the ChartDB sidebar and click the 'Add Table' icon.
This instantly creates a new table in your diagram with a randomly generated name and a single default field.
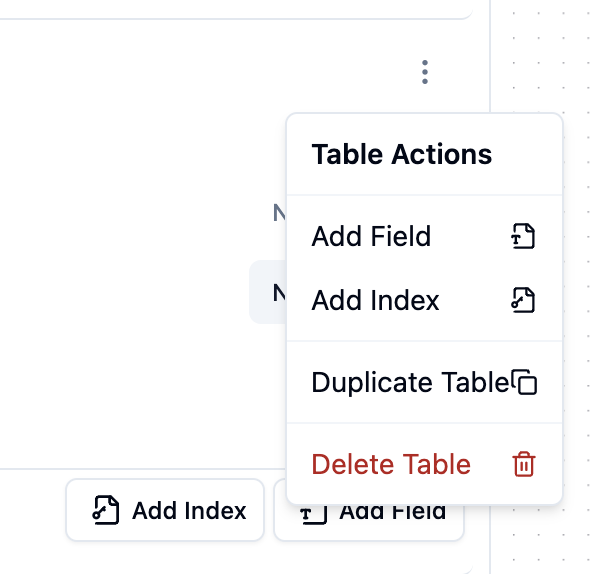
 1. **Access table actions** by clicking the settings icon next to the table name in the sidebar.
2. **Select 'Duplicate Table'** from the table actions menu.
1. **Access table actions** by clicking the settings icon next to the table name in the sidebar.
2. **Select 'Duplicate Table'** from the table actions menu.
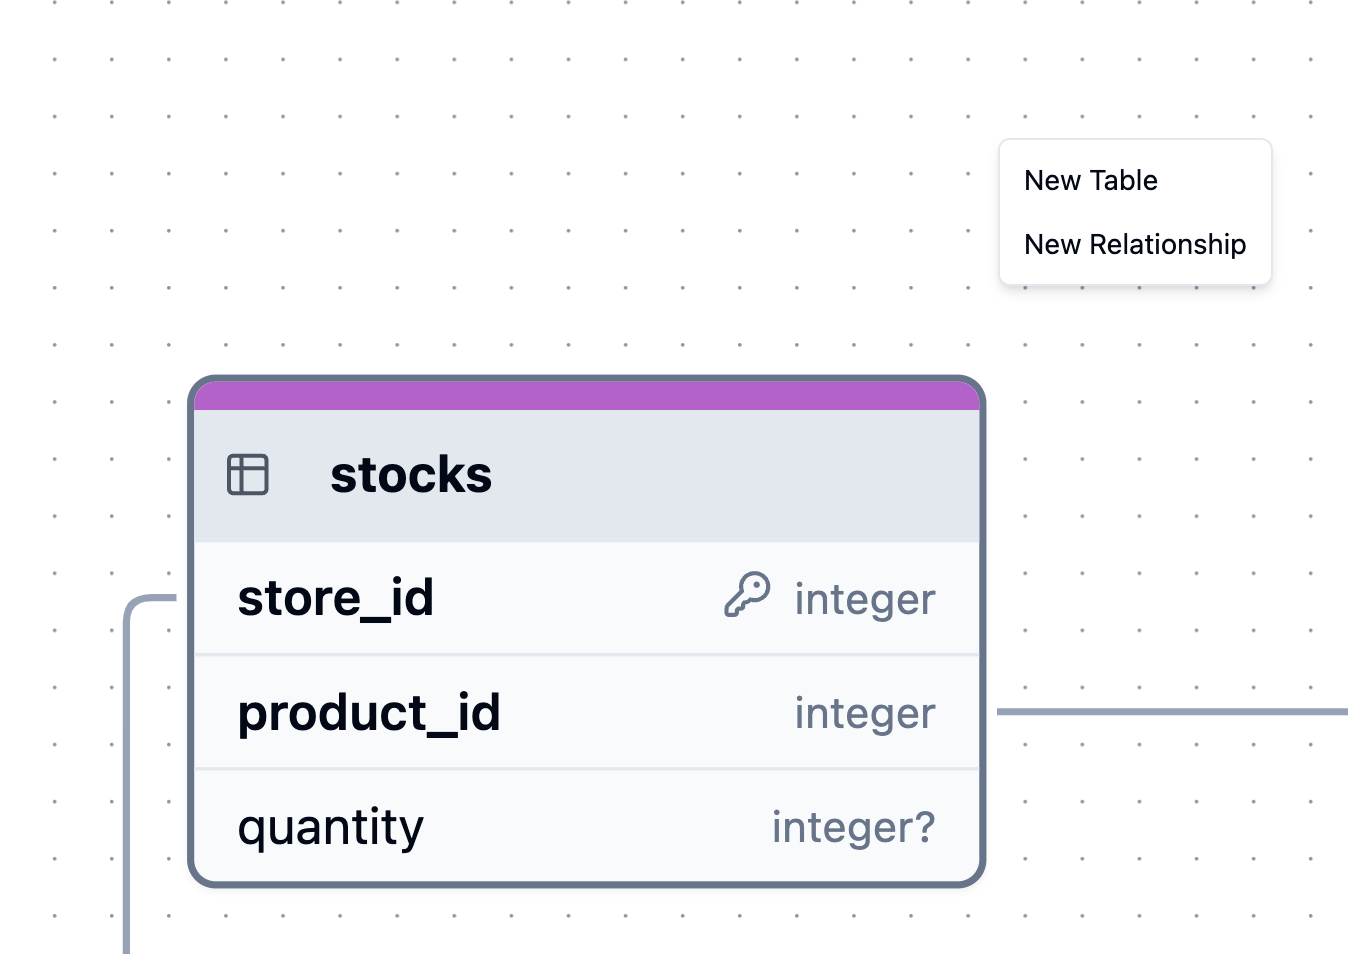
 You can also quickly add or duplicate tables directly on the canvas using the right-click context menu.
1. **Right-click anywhere on the canvas.**
2. **Select 'New Table'** to add a brand new table, or **'Duplicate Table'** after selecting an existing table to clone it.
You can also quickly add or duplicate tables directly on the canvas using the right-click context menu.
1. **Right-click anywhere on the canvas.**
2. **Select 'New Table'** to add a brand new table, or **'Duplicate Table'** after selecting an existing table to clone it.
 You can also **edit table names directly on the canvas** by double-clicking the table name. This provides a quick and intuitive way to rename tables as you are visualizing your diagram.
## Managing Schemas
In ChartDB, tables are organized within **Schemas**. Schemas act like folders, providing a way to structure and group your tables, especially in databases like PostgreSQL and MSSQL that support them.
You can also **edit table names directly on the canvas** by double-clicking the table name. This provides a quick and intuitive way to rename tables as you are visualizing your diagram.
## Managing Schemas
In ChartDB, tables are organized within **Schemas**. Schemas act like folders, providing a way to structure and group your tables, especially in databases like PostgreSQL and MSSQL that support them.
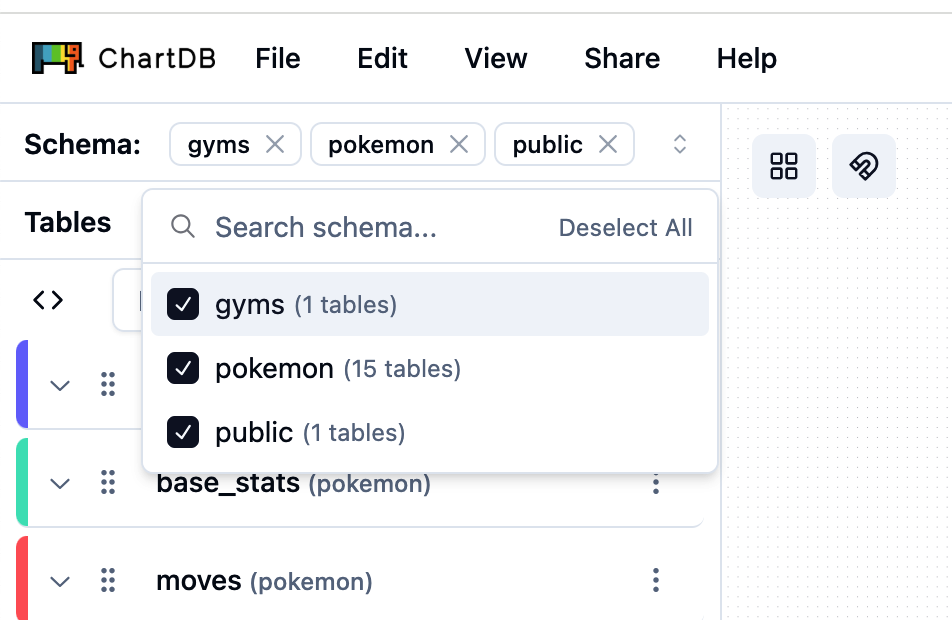 Schemas will only be displayed in the sidebar if your imported database is configured with schemas.
By default, only the `public` schema is displayed when schemas are present in your database.
New tables added using the **Add Table** functionality will be placed within the currently active schema, which defaults to the `public` schema if not otherwise specified.
## Add New Fields
Whether you're refining your schema or adding new attributes, here’s how to add fields to your tables in ChartDB.
1. **Scroll to the bottom** of the specific table's details section in the
sidebar. 2. **Click the 'Add Field' button**.
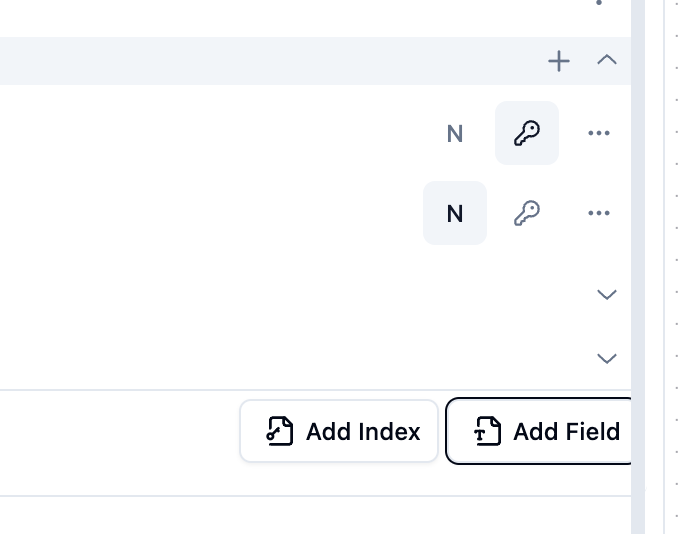
1. **Expand the 'Fields' section** for the specific table in the sidebar.
2. **Click the '+' icon** next to the 'Fields' header.
Schemas will only be displayed in the sidebar if your imported database is configured with schemas.
By default, only the `public` schema is displayed when schemas are present in your database.
New tables added using the **Add Table** functionality will be placed within the currently active schema, which defaults to the `public` schema if not otherwise specified.
## Add New Fields
Whether you're refining your schema or adding new attributes, here’s how to add fields to your tables in ChartDB.
1. **Scroll to the bottom** of the specific table's details section in the
sidebar. 2. **Click the 'Add Field' button**.
1. **Expand the 'Fields' section** for the specific table in the sidebar.
2. **Click the '+' icon** next to the 'Fields' header.
 Similar to tables, you can **edit field names directly on the canvas** by double-clicking the field name within a table. This allows for in-place editing of field names directly in your diagram.
This will instantly add a new field to your selected table with a default name (e.g., `field_4`) and a default data type.
## Configure Field Attributes
Once you've added a new field or need to modify an existing one, ChartDB provides configurable field attributes.
To rename a field, simply click on the current field name in the sidebar and type in the new desired name.
To change a field's data type, click the dropdown menu next to the current data type. This will display a list of available data types supported by your imported database.
Similar to tables, you can **edit field names directly on the canvas** by double-clicking the field name within a table. This allows for in-place editing of field names directly in your diagram.
This will instantly add a new field to your selected table with a default name (e.g., `field_4`) and a default data type.
## Configure Field Attributes
Once you've added a new field or need to modify an existing one, ChartDB provides configurable field attributes.
To rename a field, simply click on the current field name in the sidebar and type in the new desired name.
To change a field's data type, click the dropdown menu next to the current data type. This will display a list of available data types supported by your imported database.
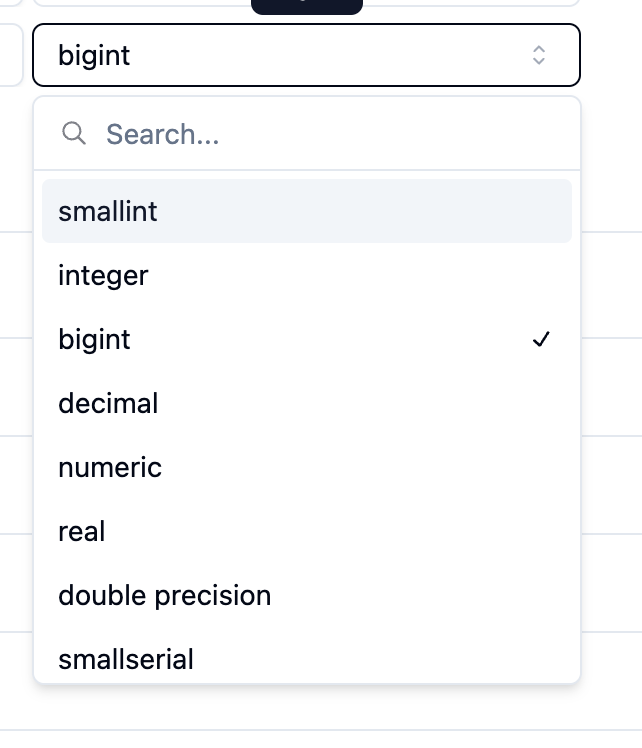 Available data types are determined by the database you imported into ChartDB.
By default, new fields are often set as nullable. To toggle a field's
nullability, click the 'N' icon next to the field.
To designate a field as a primary key, click the 'P' icon next to the field.
Click the three dots icon next to the field to access additional attributes. Check the 'Unique' checkbox to enforce a unique constraint. Use the 'Comments' text area to add field-level comments.
Available data types are determined by the database you imported into ChartDB.
By default, new fields are often set as nullable. To toggle a field's
nullability, click the 'N' icon next to the field.
To designate a field as a primary key, click the 'P' icon next to the field.
Click the three dots icon next to the field to access additional attributes. Check the 'Unique' checkbox to enforce a unique constraint. Use the 'Comments' text area to add field-level comments.
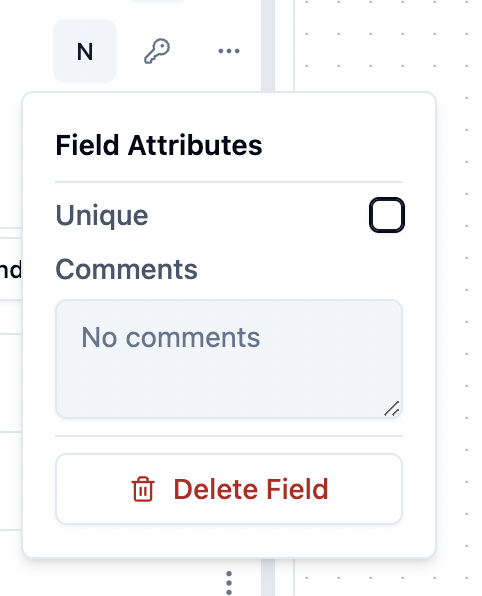 Field-level comments are distinct from table-level comments, which can be added in the table's top-level settings.