> ## Documentation Index
> Fetch the complete documentation index at: https://docs.chartdb.io/llms.txt
> Use this file to discover all available pages before exploring further.
# Visualize Dependencies
> Explore and understand database relationships between Views and Tables in ChartDB
 In ChartDB, dependencies focus on database Views and their underlying Tables.
ChartDB automatically detects and displays dependencies based on the imported
database schema, specifically from View definitions. You cannot manually
create or edit dependencies directly within ChartDB at this time.
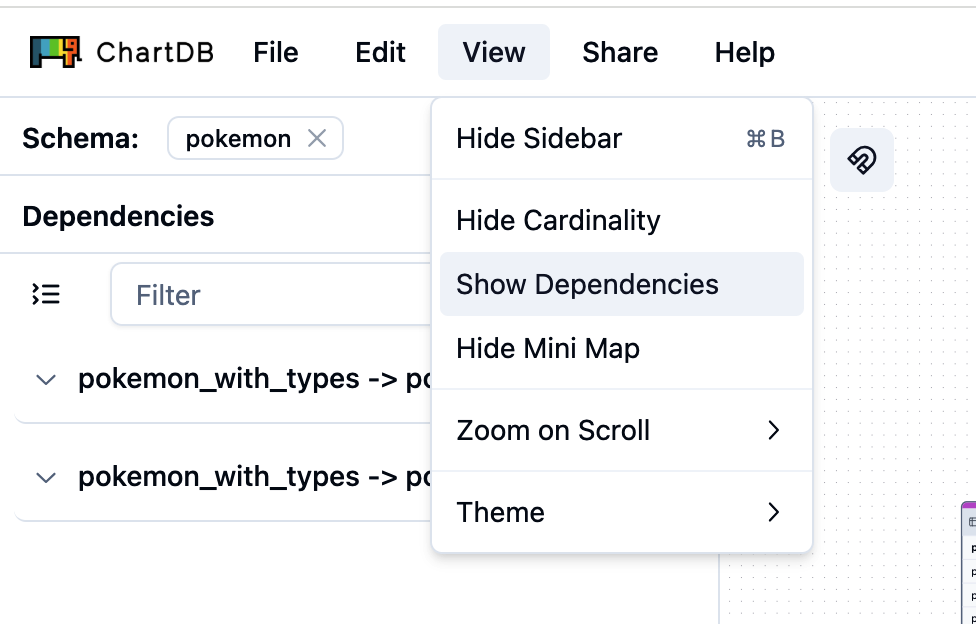
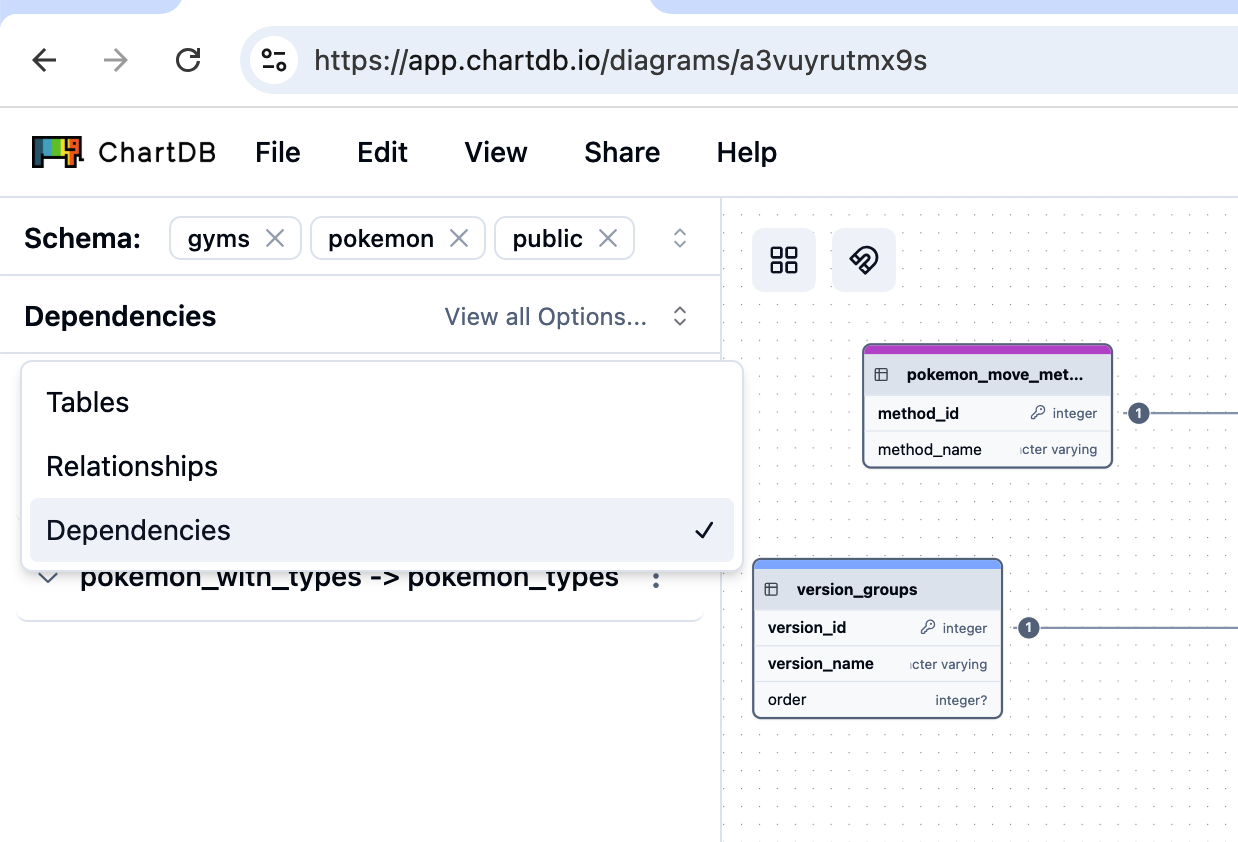
## View Dependencies
ChartDB provides a dedicated "Dependencies" section in the sidebar to easily explore these relationships.
Navigate to the **Dependencies** section in the ChartDB sidebar.
In ChartDB, dependencies focus on database Views and their underlying Tables.
ChartDB automatically detects and displays dependencies based on the imported
database schema, specifically from View definitions. You cannot manually
create or edit dependencies directly within ChartDB at this time.
## View Dependencies
ChartDB provides a dedicated "Dependencies" section in the sidebar to easily explore these relationships.
Navigate to the **Dependencies** section in the ChartDB sidebar.
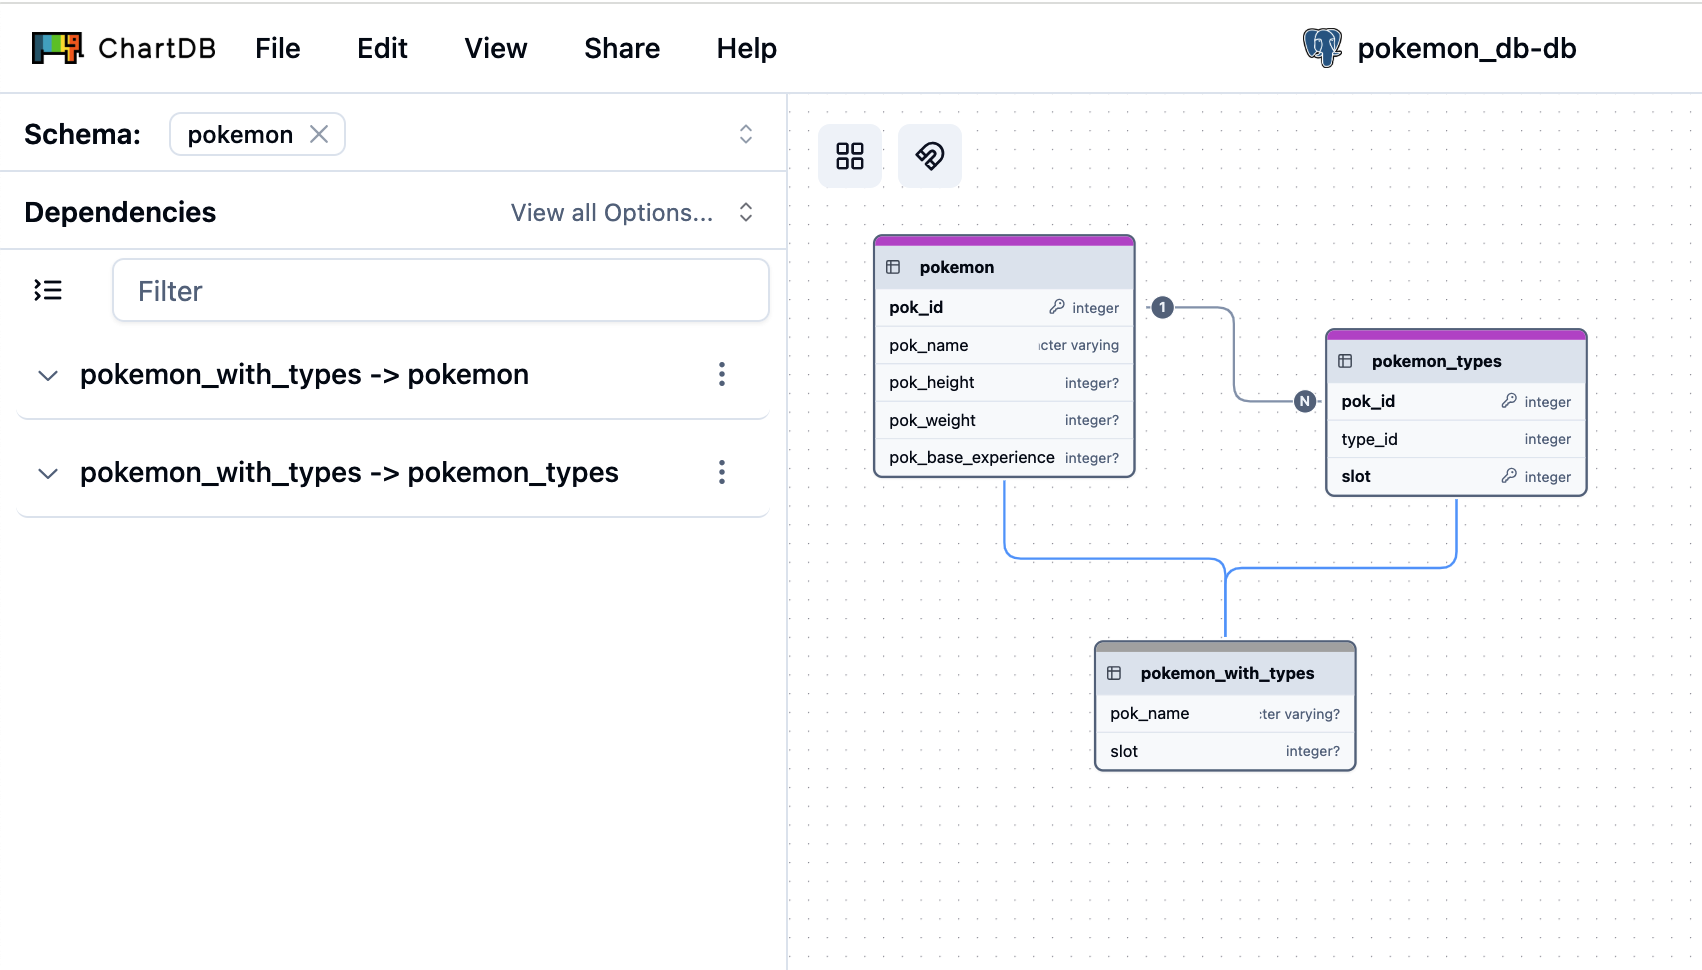
 Select a View from the Dependencies list. ChartDB will highlight the selected View and the Tables it depends on directly on your database diagram canvas.